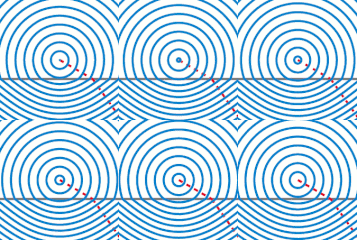
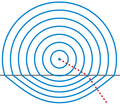
Dosya:Snells law wavefronts.gif
Snells_law_wavefronts.gif ((225 × 227 piksel, dosya boyutu: 65 KB, MIME tipi: image/gif), döngüye girdi, 10 kare, 0,1 sn)

|
Bu bir seçkin resimdir. Vikipedi topluluğu tarafından güzel, şaşırtıcı, etkileyici ve/veya bilgilendirici bulunan bu resme seçkin resim statüsü verilmiş ve kullanıldığı maddeye önemli ölçüde katkı sağladığına karar verilmiştir. Eğer benzer kalitede özgür lisans etiketli bir resminiz varsa, yükleyebilir ve aday gösterebilirsiniz. |
| Bu resim 3 Mayıs 2009 tarihinde Türkçe Vikipedi'de günün seçkin resmi olmuştur. |
| Bu resim 26 Haziran 2015 tarihinde Türkçe Vikipedi'de günün seçkin resmi olmuştur. |
Dosya geçmişi
Dosyanın herhangi bir zamandaki hâli için ilgili tarih/saat kısmına tıklayın.
| Tarih/Saat | Küçük resim | Boyutlar | Kullanıcı | Yorum | |
|---|---|---|---|---|---|
| güncel | 09.59, 5 Temmuz 2009 |  | 225 × 227 (65 KB) | Capmo | reduced to 16 colors with no quality loss |
| 06.31, 2 Ocak 2008 |  | 225 × 227 (148 KB) | Oleg Alexandrov | {{Information |Description=Illustration of wavefronts in the context of Snell's law. |Source=self-made with MATLAB |Date=05:36, 1 January 2008 (UTC) |Author= Oleg Alexandrov |Permission= |oth |
Dosya kullanımı
Bu görüntü dosyasına bağlantısı olan sayfalar:
- Snell yasası
- Kullanıcı:BIYIKLI
- Kullanıcı:Fatih.kaya.123
- Kullanıcı mesaj:Aycan/Arşiv8
- Vikipedi:Günün seçkin resmi/Eylül 2022
- Vikipedi:Günün seçkin resmi/Haziran 2015
- Vikipedi:Günün seçkin resmi/Mayıs 2009
- Vikipedi:Seçkin resim adayları/Arşiv/Ocak 2009
- Vikipedi:Seçkin resim adayları/Snells law wavefronts.gif
- Vikipedi:Seçkin resimler/Ana sayfaya çıkmış resimler/2009 listesi
- Vikipedi:Seçkin resimler/Ana sayfaya çıkmış resimler/2015 listesi
- Vikipedi:Seçkin resimler/Bilim/Diğer
- Şablon:GSR/2009-05-03
- Şablon:GSR/2015-06-26
- Şablon:GSR/2022-09-16
Küresel dosya kullanımı
Aşağıdaki diğer vikiler bu dosyayı kullanır:
- ast.wikipedia.org üzerinde kullanımı
- bg.wikipedia.org üzerinde kullanımı
- cs.wikiversity.org üzerinde kullanımı
- cy.wikipedia.org üzerinde kullanımı
- de.wikipedia.org üzerinde kullanımı
- de.wikibooks.org üzerinde kullanımı
- el.wikipedia.org üzerinde kullanımı
- en.wikipedia.org üzerinde kullanımı
- Snell's law
- User talk:Clarknova
- User:Oleg Alexandrov/Pictures
- User:Devinma
- Wikipedia:Featured pictures/Diagrams, drawings, and maps/Diagrams
- User talk:Oleg Alexandrov/Archive13
- Wikipedia:Featured pictures thumbs/15
- Wikipedia:Featured picture candidates/January-2009
- Wikipedia:Featured picture candidates/Snells law wavefronts
- Wikipedia:Wikipedia Signpost/2009-01-10/Features and admins
- Wikipedia:Picture of the day/September 2009
- Template:POTD/2009-09-23
- Wikipedia:Wikipedia Signpost/2009-01-10/SPV
- User:VGrigas (WMF)/Quality Media
- Wikipedia:Wikipedia Signpost/Single/2009-01-10
- en.wikibooks.org üzerinde kullanımı
- en.wikiversity.org üzerinde kullanımı
- eo.wikipedia.org üzerinde kullanımı
- es.wikipedia.org üzerinde kullanımı
- et.wikipedia.org üzerinde kullanımı
- fa.wikipedia.org üzerinde kullanımı
- frr.wikipedia.org üzerinde kullanımı
- fr.wikipedia.org üzerinde kullanımı
- fr.wikibooks.org üzerinde kullanımı
- he.wikipedia.org üzerinde kullanımı
- hi.wikipedia.org üzerinde kullanımı
- hr.wikipedia.org üzerinde kullanımı
- it.wikipedia.org üzerinde kullanımı
- ka.wikipedia.org üzerinde kullanımı
- ko.wikipedia.org üzerinde kullanımı
- lmo.wikipedia.org üzerinde kullanımı
- mk.wikipedia.org üzerinde kullanımı
Bu dosyanın daha fazla küresel kullanımını görüntüle.


