
Dosya:QuantumOccupancies.png
Daha yüksek çözünürlüğe sahip sürüm bulunmamaktadır.
QuantumOccupancies.png ((431 × 599 piksel, dosya boyutu: 22 KB, MIME tipi: image/png))
Bu dosya Wikimedia Commons'ta bulunmaktadır. Dosyanın açıklaması aşağıda gösterilmiştir. Commons, serbest/özgür telifli medya dosyalarının bulundurulduğu depodur. Siz de yardım edebilirsiniz. |
Özet
| Açıklama |
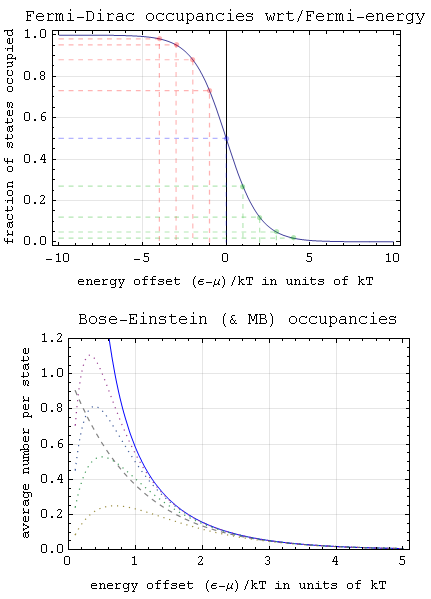
English: Quantum occupancy nomograms, where for example when (ε-μ) = kT we find that fFD = 1/(e+1) ≈ 0.269, fMB = 1/e ≈ 0.368, and fBE = 1/(e-1) ≈ 0.582 so that for a given value of (ε-μ)/kT, as expected, fFD ≤ fMB ≤ fBE.
At top: The dashed lines denote filling fractions for Fermi-Dirac (FD) states whose energy ε is offset by integer-multiples of kT from the Fermi chemical-potential μ. In the FD case, the average number of particles per state and the fraction of states occupied are one and the same. At bottom: The "low-density" Maxwell-Boltzmann (MB) approximation is a dashed grey curve which neglects chemical potential μ altogether, and it is also the fraction of Bose-Einstein (BE) states occupied. From bottom up the dotted curves denote contributions to the BE particle-average from those occupied energy-levels which have a population of one, two, three and four particles (or excitations), respectively. |
| Tarih | |
| Kaynak | Yükleyenin kendi çalışması |
| Yazar | P. Fraundorf |
Lisanslama
Ben, bu işin telif sahibi, burada işi aşağıdaki lisans altında yayımlıyorum:
Bu dosya, Creative Commons Atıf-Benzer Paylaşım 3.0 Taşınmamış lisansı ile lisanslanmıştır
- Şu seçeneklerde özgürsünüz:
- paylaşım – eser paylaşımı, dağıtımı ve iletimi
- içeriği değiştirip uyarlama – eser adaptasyonu
- Aşağıdaki koşullar geçerli olacaktır:
- atıf – Esere yazar veya lisans sahibi tarafından belirtilen (ancak sizi ya da eseri kullanımınızı desteklediklerini ileri sürmeyecek bir) şekilde atıfta bulunmalısınız.
- benzer paylaşım – Maddeyi yeniden karıştırır, dönüştürür veya inşa ederseniz, katkılarınızı orijinal olarak aynı veya uyumlu lisans altında dağıtmanız gerekir.
Dosya geçmişi
Dosyanın herhangi bir zamandaki hâli için ilgili tarih/saat kısmına tıklayın.
| Tarih/Saat | Küçük resim | Boyutlar | Kullanıcı | Yorum | |
|---|---|---|---|---|---|
| güncel | 14.38, 12 Kasım 2013 | | 431 × 599 (22 KB) | Unitsphere | User created page with UploadWizard |
Dosya kullanımı
Bu görüntü dosyasına bağlantısı olan sayfalar:
Küresel dosya kullanımı
Aşağıdaki diğer vikiler bu dosyayı kullanır:
- ar.wikipedia.org üzerinde kullanımı
- en.wikipedia.org üzerinde kullanımı