
Dosya:Kakaobohnenanbau 2005.PNG
Bu önizlemenin boyutu: 800 × 351 piksel. Diğer çözünürlükler: 320 × 140 piksel | 640 × 281 piksel | 1.425 × 625 piksel.
Tam çözünürlük ((1.425 × 625 piksel, dosya boyutu: 30 KB, MIME tipi: image/png))
Bu dosya Wikimedia Commons'ta bulunmaktadır. Dosyanın açıklaması aşağıda gösterilmiştir. Commons, serbest/özgür telifli medya dosyalarının bulundurulduğu depodur. Siz de yardım edebilirsiniz. |
Özet
| Açıklama |
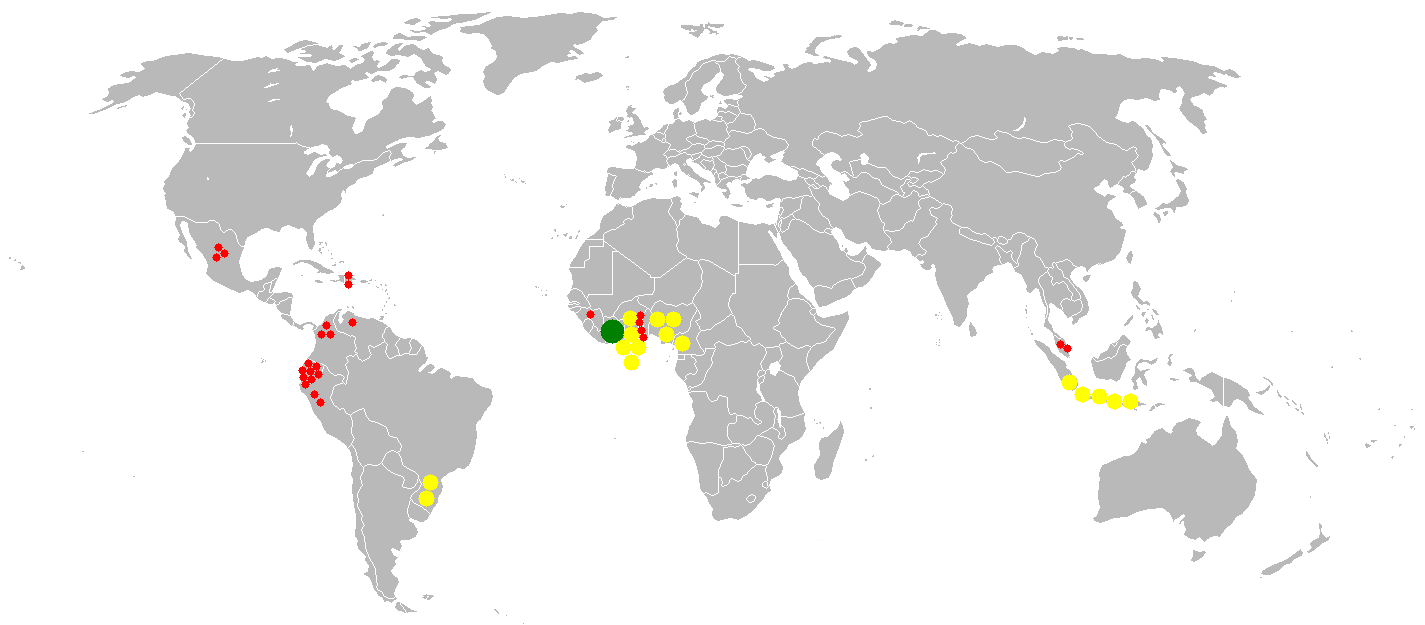
English: This bubble map shows the global distribution of cocoa bean output in 2005 as a percentage of the top producer (Côte d'Ivoire - 1,286,330 tonnes). Legend: Cocoa output in 2005 shown as a percentage of the top producer (Cote d'Ivoire - 1,286,330 tonnes) Notes on the technical realization and data source of the map: English: This map is consistent with incomplete set of data too as long as the top producer is known. It resolves the accessibility issues faced by colour-coded maps that may not be properly rendered in old computer screens. Data was extracted on 18th June 2007 from http://faostat.fao.org/site/336/DesktopDefault.aspx?PageID=336
Deutsch: Die Karte zeigt den Anbau von Kakao im Jahr 2005 in Prozent des Hauptproduzenten Elfenbeinküste (=1.286.330 Tonnen). 100% 10% 1% |
| Tarih | (UTC) |
| Kaynak |
Bu dosya şu kaynaktan türetilmiştir: 2005cocoa bean.PNG: |
| Yazar |
|
| Bu rötuşlanmış bir resim olup, resmin özgün hâli üzerinde oynama yapılarak elde edilmiştir. Yapılan değişiklikler: deleting legend.Resmin özgün hâline şuradan erişilebilir: 2005cocoa bean.PNG. Resimdeki düzenlemeler Generator tarafından yapılmıştır.
|
Lisanslama
| Bu iş yazarı Vardion, E Pluribus Anthony, Anwar saadat and Generator tarafından kamu malı olarak yayınlanmıştır. Bu dünya çapında geçerlidir. Bazı ülkelerde bu yasal olarak mümkün olmayabilir; öyleyse: Vardion, E Pluribus Anthony, Anwar saadat and Generator, bu işi herhangi bir amaç için, herhangi bir şart olmaksızın, yasalarca gerekli olmadıkça, herkesin kullanmasına izin veriyor.
|
Orijinal yükleme günlüğü
This image is a derivative work of the following images:
- File:2005cocoa_bean.PNG licensed with PD-author
- 2011-07-01T16:50:10Z Saibo 1425x625 (59340 Bytes) raw descs: {{Information |Description={{en|This [[:en:User:Anwar_saadat/bubble_maps_(FAQ)|bubble map]] shows the global distribution of cocoa bean output in 2005 as a percentage of the top producer (Côte d'Ivoire - 1,286,33
Uploaded with derivativeFX
Dosya geçmişi
Dosyanın herhangi bir zamandaki hâli için ilgili tarih/saat kısmına tıklayın.
| Tarih/Saat | Küçük resim | Boyutlar | Kullanıcı | Yorum | |
|---|---|---|---|---|---|
| güncel | 15.13, 17 Şubat 2012 | | 1.425 × 625 (30 KB) | Quedel | == {{int:filedesc}} == {{Information |Description={{en|1=This bubble map shows the global distribution of cocoa bean output in 2005 as a percentage of the top producer (Côte d'Ivoire - 1,286,330 tonnes). ''Leg |
Dosya kullanımı
Bu görüntü dosyasına bağlantısı olan sayfalar:
Küresel dosya kullanımı
Aşağıdaki diğer vikiler bu dosyayı kullanır:
- de.wikipedia.org üzerinde kullanımı