
Dosya:Income percentiles, with median and relative poverty levels marked.png

Bu önizlemenin boyutu: 800 × 451 piksel. Diğer çözünürlükler: 320 × 180 piksel | 640 × 361 piksel | 1.024 × 577 piksel | 1.280 × 721 piksel | 1.942 × 1.094 piksel.
Tam çözünürlük ((1.942 × 1.094 piksel, dosya boyutu: 75 KB, MIME tipi: image/png))
Bu dosya Wikimedia Commons'ta bulunmaktadır. Dosyanın açıklaması aşağıda gösterilmiştir. Commons, serbest/özgür telifli medya dosyalarının bulundurulduğu depodur. Siz de yardım edebilirsiniz. |
Özet
| Açıklama |
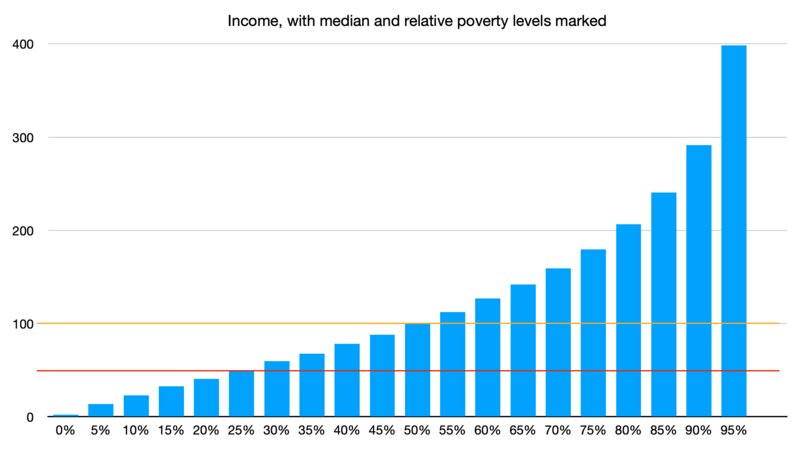
English: Percentile curve for household income. This curve roughly follows the 2023 household income for the US, set to arbitrary units. The median household (50th percentile, orange line) earns "100" (100% of the median income). Relative poverty is marked at "50" (50% of the median income, red line). In this dataset, that point lines up with the 25th percentile. |
| Tarih | |
| Kaynak | Yükleyenin kendi çalışması |
| Yazar | WhatamIdoing |
Lisanslama
Ben, bu işin telif sahibi, burada işi aşağıdaki lisans altında yayımlıyorum:
| Bu dosya Creative Commons Evrensel Kamu Malı İthafı altındadır. | |
| Bu çalışmayı oluşturan kişi bu senet ile eser hakkında tüm dünya çapında telif hakkı yasaları kapsamında, yasalar tarafından izin verilen ölçülerde ve diğer benzer tüm haklarından feragat etmiş ve kamu malı olarak nitelendirmiştir. Siz bu çalışmayı ve eseri hiç bir izin almadan ticari amaçlar da dahil olmak üzere kopyalayabilir, değiştirebilir ve serbestçe dağıtabilirsiniz.
|
Dosya geçmişi
Dosyanın herhangi bir zamandaki hâli için ilgili tarih/saat kısmına tıklayın.
| Tarih/Saat | Küçük resim | Boyutlar | Kullanıcı | Yorum | |
|---|---|---|---|---|---|
| güncel | 00.45, 19 Mart 2024 | | 1.942 × 1.094 (75 KB) | WhatamIdoing | Uploaded own work with UploadWizard |
Dosya kullanımı
Bu görüntü dosyasına bağlantısı olan sayfalar:
Küresel dosya kullanımı
Aşağıdaki diğer vikiler bu dosyayı kullanır:
- en.wikipedia.org üzerinde kullanımı