Dosya:Partial transmittance.gif

Sayfa içeriği diğer dillerde desteklenmemektedir.
Vikipedi, özgür ansiklopedi

Partial_transmittance.gif((367 × 161 piksel, dosya boyutu: 67 KB, MIME tipi: image/gif), döngüye girdi, 53 kare, 4,2 sn)


Özet

Açıklama
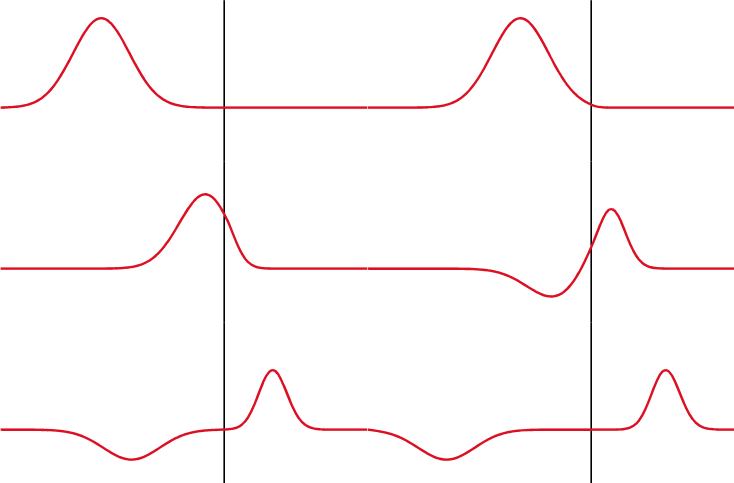
Русский: Показано классическое отражение/прохождение солитона гауссового импульса от/в более плотную среду. В реальности же, свет отражается не от поверхности, а от всех частиц тела (см. ru:КЭД).
English: Illustration of partial reflection of a wave. A gaussian wave on a one-dimensional string strikes a boundary with transmission coefficient of 0.5. Half the wave is transmitted and half is reflected.
Français : Illustration de la réflection partielle d'une onde. Une onde gaussienne se déplaçant sur un ressort unidimensionnel est réfléchie/transmise au niveau d'une interface avec un coefficient de transmission de 0.5.
Español: Ilustración de una reflexión parcial de una onda. Una onda gaussiana sobre una cuerda de una dimensión choca contra un limite con un coeficiente de transmisión de 0.5. La mitad de la onda es transmitida y la otra mitad es reflejada.
Tarih
Kaynak self-made with MATLAB, source code below
Yazar Oleg Alexandrov
 
Bu GIF grafik MATLAB ile oluşturuldu.

Lisanslama

Public domain Ben, bu işin telif sahibi, bu işi kamu malı olarak yayınlıyorum. Bu dünya çapında geçerlidir.
Bazı ülkelerde bu yasal olarak mümkün olmayabilir; öyleyse:
Ben, bu işi herhangi bir amaç için, herhangi bir şart olmaksızın, yasalarca gerekli olmadıkça, herkesin kullanmasına izin veriyorum.

MATLAB source code

% Partial transmittance and reflectance of a wave
% Code is messed up, don't have time to clean it now
function main()
 
   % KSmrq's colors
   red    = [0.867 0.06 0.14];
   blue   = [0, 129, 205]/256;
   green  = [0, 200,  70]/256;
   yellow = [254, 194,   0]/256;
   white = 0.99*[1, 1, 1];
   black = [0, 0, 0];
 
   % length of the string and the grid
   L = 5;
   N = 151;
   X=linspace(0, L, N);
 
   h = X(2)-X(1); % space grid size
   c = 0.01; % speed of the wave
   tau = 0.25*h/c; % time grid size
 
   % form a medium with a discontinuous wave speed
   C = 0*X+c;
 
   D=L/2;
   c_right = 0.5*c; % speed to the right of the disc
   for i=1:N
      if X(i) > D
         C(i) = c_right;
      end
   end
   % Now C = c for x < D, and C=c_right for x > D
 
   K = 5; % steepness of the bump
   S = 0; % shift the wave
   f=inline('exp(-K*(x-S).^2)', 'x', 'S', 'K'); % a gaussian as an initial wave
   df=inline('-2*K*(x-S).*exp(-K*(x-S).^2)', 'x', 'S', 'K'); % derivative of f
 
   % wave at time 0 and tau
   U0 = 0*f(X, S, K);
   U1 = U0 - 2*tau*c*df(X, S, K);
 
   U = 0*U0; % current U
 
   % plot between Start and End
   Start=130; End=500;
 
   % hack to capture the first period of the wave
   min_k = 2*N; k_old = min_k; turn_on = 0; 
 
   frame_no = 0;
   for j=1:End
 
      %  fixed end points
      U(1)=0; U(N)=0;
 
      % finite difference discretization in time
      for i=2:(N-1)
         U(i) = (C(i)*tau/h)^2*(U1(i+1)-2*U1(i)+U1(i-1)) + 2*U1(i) - U0(i);
      end
 
      % update info, for the next iteration
      U0 = U1; U1 = U;
 
      spacing=7;
 
     % plot the wave
      if rem(j, spacing) == 1 & j > Start
 
         figure(1); clf; hold on;
         axis equal; axis off; 
         lw = 3; % linewidth
 
         % size of the window
         ys = 1.2;
 
         low = -0.5*ys;
         high = ys;
         plot([D, D], [low, high], 'color', black, 'linewidth', 0.7*lw)
%         fill([X(1), D, D, X(1)], [low, low, high, high], [0.9, 1, 1], 'edgealpha', 0);
%         fill([D X(N), X(N), D],  [low, low, high, high], [1, 1, 1], 'edgealpha', 0);
 
         plot(X, U, 'color', red, 'linewidth', lw);
 
         % plot the ends of the string
         small_rad = 0.06;
 
         axis([-small_rad, 0.82*L, -ys, ys]);
 
         % small markers to keep the bounding box fixed when saving to eps
         plot(-small_rad, ys, '*', 'color', white);
         plot(L+small_rad, -ys, '*', 'color', white);
 
         pause(0.1)
         frame_no = frame_no + 1;
         %frame=sprintf('Frame%d.eps', 1000+frame_no); saveas(gcf, frame, 'psc2');
         frame=sprintf('Frame%d.png', 1000+frame_no);% saveas(gcf, frame);
         disp(frame)
         print (frame, '-dpng', '-r300');
 
      end
   end
 
 
% The gif image was creating with the command
% convert -antialias -loop 10000  -delay 8 -compress LZW -scale 20% Frame10*png Partial_transmittance.gif
% and was later cropped in Gimp

Altyazılar

Bu dosyanın temsil ettiği şeyin tek satırlık açıklamasını ekleyin.

Bu dosyada gösterilen öğeler

betimlenen

26 Kasım 2007

Dosya geçmişi

Dosyanın herhangi bir zamandaki hâli için ilgili tarih/saat kısmına tıklayın.

Tarih/SaatKüçük resimBoyutlarKullanıcıYorum
güncel16.36, 9 Nisan 201016.36, 9 Nisan 2010 tarihindeki sürümün küçültülmüş hâli367 × 161 (67 KB)Aiyizooptimized animation
05.56, 26 Kasım 200705.56, 26 Kasım 2007 tarihindeki sürümün küçültülmüş hâli367 × 161 (86 KB)Oleg Alexandrov{{Information |Description=Illustration of en:Transmission coefficient (optics) |Source=self-made with MATLAB, source code below |Date=~~~~~ |Author= Oleg Alexandrov |Permission=PD-self, see below |other_versions= }} {{PD-se

Bu görüntü dosyasına bağlantısı olan sayfalar:

Küresel dosya kullanımı

Aşağıdaki diğer vikiler bu dosyayı kullanır:

Bu dosyanın daha fazla küresel kullanımını görüntüle.