
Dosya:Normal distribution and scales.gif
Tam çözünürlük ((1.200 × 687 piksel, dosya boyutu: 39 KB, MIME tipi: image/gif))
Bu dosya Wikimedia Commons'ta bulunmaktadır. Dosyanın açıklaması aşağıda gösterilmiştir. Commons, serbest/özgür telifli medya dosyalarının bulundurulduğu depodur. Siz de yardım edebilirsiniz. |

|
File:The Normal Distribution.svg, bu dosyanın vektör versiyonudur. Bu raster görüntünün yerine kullanılmalıdır.
File:Normal distribution and scales.gif → File:The Normal Distribution.svg
Daha fazla bilgi için Help:SVG/tr sayfasına bakın. |
 |
en.wikipedia üzerinden Commons'a Maksim tarafından transfer edildi.
Özet
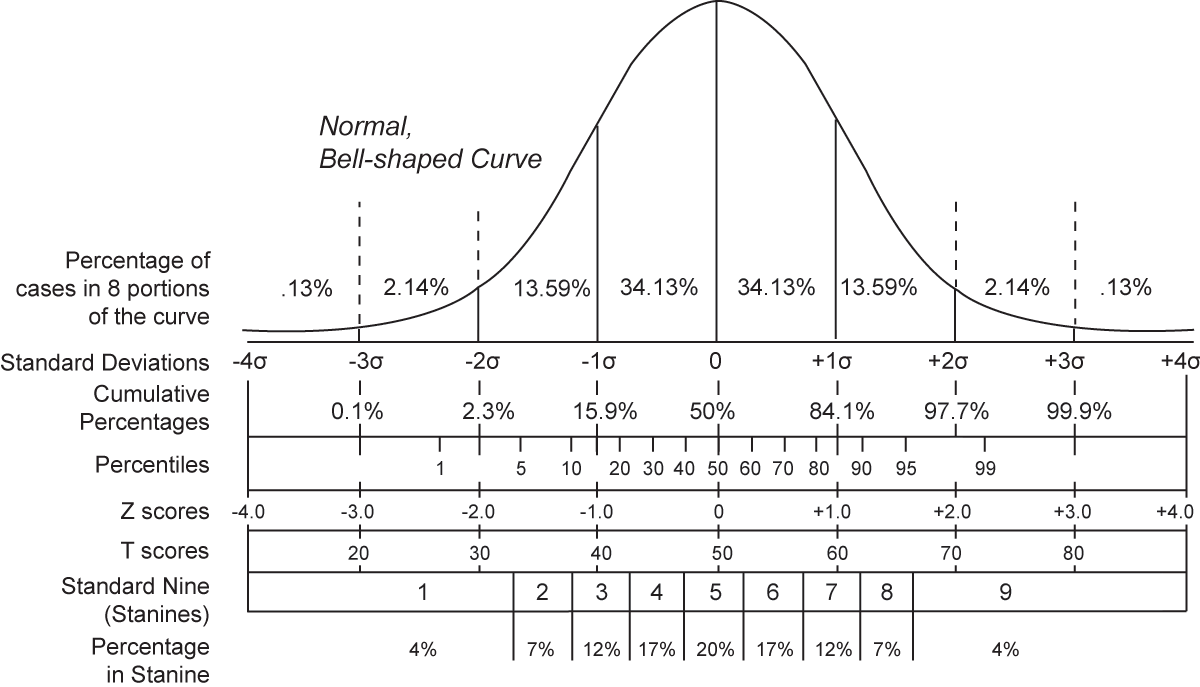
A chart comparing the various grading methods in a normal distribution. Includes: Standard deviations, cumulative percentages, percentile equivalents, Z-scores, T-scores, standard nine, percentage in stanine. Inspired by Figure 4.3 on Page 74 of Ward, A. W., Murray-Ward, M. (1999). Assessment in the Classroom. Belmont, CA: Wadsworth. ISBN 0534527043
Lisanslama
| Ben, bu işin telif sahibi, bu işi kamu malı olarak yayınlıyorum. Bu dünya çapında geçerlidir. Bazı ülkelerde bu yasal olarak mümkün olmayabilir; öyleyse: Ben, bu işi herhangi bir amaç için, herhangi bir şart olmaksızın, yasalarca gerekli olmadıkça, herkesin kullanmasına izin veriyorum. |
| date/time | username | edit summary |
|---|---|---|
| 22:09, 19 December 2005 | en:User:Jeremykemp | (ISBN) |
| 22:01, 19 December 2005 | en:User:Jeremykemp | (added reference) |
| 21:53, 19 December 2005 | en:User:Jeremykemp | (A chart comparing the various grading methods in a normal distribution. Includes: Standard deviations, cummulative precentages, percentile equivalents, Z-scores, T-scores, standard nine, percent in stanine) |
Orijinal yükleme günlüğü
Legend: (cur) = this is the current file, (del) = delete this old version, (rev) = revert to this old version.
Click on date to download the file or see the image uploaded on that date.
- (del) (cur) 21:53, 19 December 2005 . . en:User:Jeremykemp Jeremykemp ( en:User_talk:Jeremykemp Talk) . . 1200x687 (39575 bytes) (A chart comparing the various grading methods in a normal distribution. Includes: Standard deviations, cummulative precentages, percentile equivalents, Z-scores, T-scores, standard nine, percent in stanine)
Dosya geçmişi
Dosyanın herhangi bir zamandaki hâli için ilgili tarih/saat kısmına tıklayın.
| Tarih/Saat | Küçük resim | Boyutlar | Kullanıcı | Yorum | |
|---|---|---|---|---|---|
| güncel | 18.12, 20 Mart 2006 | | 1.200 × 687 (39 KB) | Maksim | La bildo estas kopiita de wikipedia:en. La originala priskribo estas: == Summary == A chart comparing the various grading methods in a normal distribution. Includes: Standard deviations, cummulative precentages, percentile equivalents, Z-scores, T-scores |
Dosya kullanımı
Bu görüntü dosyasına bağlanan sayfa yok.
Küresel dosya kullanımı
Aşağıdaki diğer vikiler bu dosyayı kullanır:
- ar.wikipedia.org üzerinde kullanımı
- ca.wikipedia.org üzerinde kullanımı
- de.wikipedia.org üzerinde kullanımı
- dv.wikipedia.org üzerinde kullanımı
- en.wikipedia.org üzerinde kullanımı
- eo.wikipedia.org üzerinde kullanımı
- es.wikipedia.org üzerinde kullanımı
- fr.wikipedia.org üzerinde kullanımı
- gl.wikipedia.org üzerinde kullanımı
- he.wikibooks.org üzerinde kullanımı
- he.wiktionary.org üzerinde kullanımı
- ko.wikipedia.org üzerinde kullanımı
- mr.wikipedia.org üzerinde kullanımı
- mwl.wikipedia.org üzerinde kullanımı
- pl.wikipedia.org üzerinde kullanımı
- pl.wiktionary.org üzerinde kullanımı
- pt.wikipedia.org üzerinde kullanımı
- pt.wikiquote.org üzerinde kullanımı
- ru.wikipedia.org üzerinde kullanımı
- simple.wiktionary.org üzerinde kullanımı
- tg.wikipedia.org üzerinde kullanımı
- zh-min-nan.wikipedia.org üzerinde kullanımı
- zh.wikipedia.org üzerinde kullanımı