
Dosya:Vesuvius SRTM3.png
Bu önizlemenin boyutu: 711 × 599 piksel. Diğer çözünürlükler: 285 × 240 piksel | 570 × 480 piksel | 942 × 794 piksel.
Tam çözünürlük ((942 × 794 piksel, dosya boyutu: 922 KB, MIME tipi: image/png))
Bu dosya Wikimedia Commons'ta bulunmaktadır. Dosyanın açıklaması aşağıda gösterilmiştir. Commons, serbest/özgür telifli medya dosyalarının bulundurulduğu depodur. Siz de yardım edebilirsiniz. |
Özet
| Açıklama |
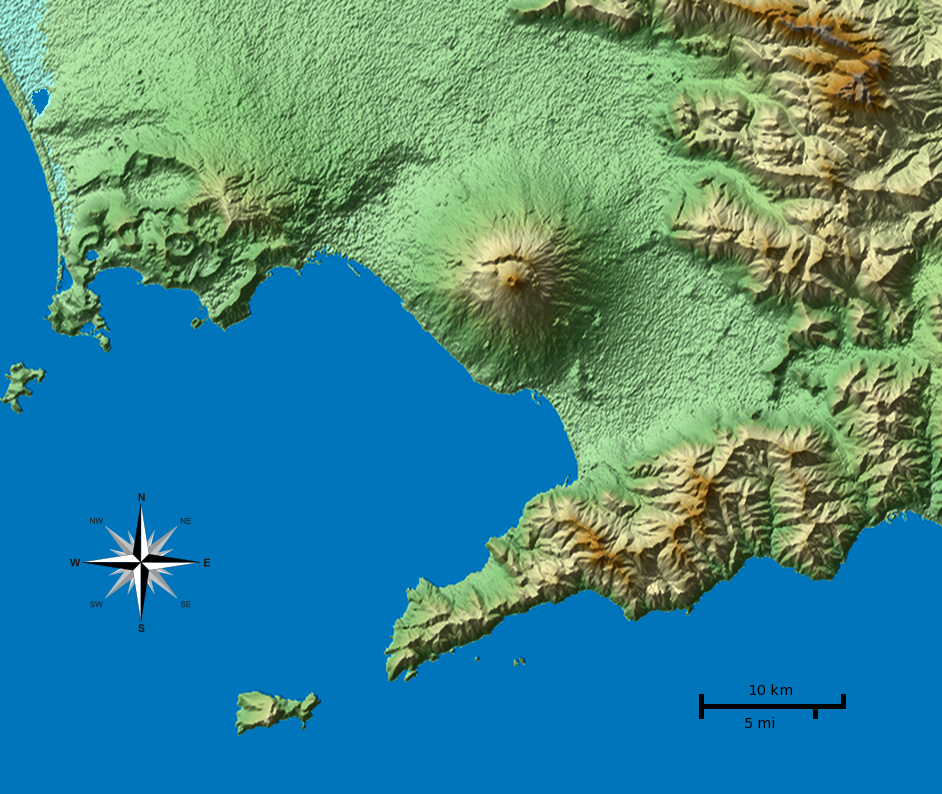
English: Shaded terrain map of the Naples and Mount Vesuvius region from SRTM3 elevation data. Each pixel corresponds to about 70x70 m. SRTM tile used was http://dds.cr.usgs.gov/srtm/version2_1/SRTM3/Eurasia/N40E014.hgt.zip. The top of the image is 41°N, the left side is 14°E.
|
| Tarih | |
| Kaynak | Yükleyenin kendi çalışması |
| Yazar |
Morn the Gorn compass rose from Maps_template-fr.svg: Eric Gaba (Sting - fr:Sting) |
| Diğer sürümler |
Bu dosyanın türev çalışmaları: Bu dosya şu kaynaktan türetilmiştir: Vesuvius SRTM3.xcf |
Code
SRTM data was plotted with the following Python 2 script (requires Python Imaging Library and NumPy) and then rescaled in Gimp to correct for the raw data aspect ratio at that latitude (about 92 m x 70 m). Terrain shading and hypsometric colors were combined in Gimp in layer multiply mode.
# Read SRTM3 file and create shaded relief

# 2010-04-05

from struct import unpack,calcsize

from numpy import *
import numpy as np
from PIL import Image

row_length = 1201	# row_length is 1201 for SRTM3 or 3601 for SRTM1
file_name  = "N40E014.hgt"	# from http://dds.cr.usgs.gov/srtm/version2_1/SRTM3/Eurasia/
hlim       = 800	# height limit for map [m]

ref_lat    = 40.55	# reference latitude
earth_eq   = 6371. * 1000. * 2. * pi
x_scale    = 1./360.*earth_eq*cos(ref_lat/180.*pi)/row_length
y_scale    = 1./360.*earth_eq/row_length

print "1 pixel = %u * %u m" % (x_scale, y_scale)
print "factor", y_scale/x_scale

h = zeros((row_length, row_length))
f = open(file_name, 'r')
li = []

for j in range(row_length):
	for i in range(row_length):
		d = f.read(2)
		(height,) = unpack('>h', d)
		h[i,j] = height
		if height < -1000:
			li.append((i,j))

hmax = h.max()
h3 = zeros_like(h)
h3[:,:] = h[:,:]
print len(li), "missing data points"

def get_nei(z):
	h2 = h[z[0]-1:z[0]+2,z[1]-1:z[1]+2]
	nn = sum(where(h2 < -1000, 0, 1))
	av = sum(where(h2 > -1000, h2, 0)) / float(nn)
	return nn, av

# fill missing points with a nearest-neighbor averaging method:
loop = len(li)
lim = 7
while loop > 0:
	sd = False
	for q in range(len(li)):
		if h[li[q]] > -1000.: continue
		n, a = get_nei(li[q])
		if n >= lim:
			print li[q],loop, n, a, lim
			h3[li[q]] = a
			loop -= 1
			sd = True
	if not sd: lim -= 1
	h[:,:] = h3[:,:]
print "missing points done"

def hext(a):
	"Hex color to triplet."
	r,g,b = a[0:2], a[2:4], a[4:6]
	return int(r, 16), int(g, 16), int(b, 16)

# from http://en.wikipedia.org/wiki/Wikipedia:WikiProject_Maps/Conventions/Topographic_maps:
col_sea = hext("0978ab")
cols = """
{{Mapcolor|r=245|v=244|b=242|hex=#F5F4F2|col=black}}
{{Mapcolor|r=224|v=222|b=216|hex=#E0DED8|col=black}}
{{Mapcolor|r=202|v=195|b=184|hex=#CAC3B8|col=black}}
{{Mapcolor|r=186|v=174|b=154|hex=#BAAE9A|col=black}}
{{Mapcolor|r=172|v=154|b=124|hex=#AC9A7C|col=black}}
{{Mapcolor|r=170|v=135|b=83|hex=#AA8753|col=black}}
{{Mapcolor|r=185|v=152|b=90|hex=#B9985A|col=black}}
{{Mapcolor|r=195|v=167|b=107|hex=#C3A76B|col=black}}
{{Mapcolor|r=202|v=185|b=130|hex=#CAB982|col=black}}
{{Mapcolor|r=211|v=202|b=157|hex=#D3CA9D|col=black}}
{{Mapcolor|r=222|v=214|b=163|hex=#DED6A3|col=black}}
{{Mapcolor|r=232|v=225|b=182|hex=#E8E1B6|col=black}}
{{Mapcolor|r=239|v=235|b=192|hex=#EFEBC0|col=black}}
{{Mapcolor|r=225|v=228|b=181|hex=#E1E4B5|col=black}}
{{Mapcolor|r=209|v=215|b=171|hex=#D1D7AB|col=black}}
{{Mapcolor|r=189|v=204|b=150|hex=#BDCC96|col=black}}
{{Mapcolor|r=168|v=198|b=143|hex=#A8C68F|col=black}}
{{Mapcolor|r=148|v=191|b=139|hex=#94BF8B|col=black}}
{{Mapcolor|r=172|v=208|b=165|hex=#ACD0A5|col=black}}
"""
col = []

for l in cols.splitlines():
	if len(l) < 10: continue
	i = l.find('#')
	if i > -1:
		col.append(hext(l[i+1:i+7]))

col.reverse()	# -> bottom to top

o = Image.new('RGB', h.shape)

def interp(c, f):
	"Interpolate into color table."
	r = int((1.-f) * col[c][0] + f * col[c+1][0])
	g = int((1.-f) * col[c][1] + f * col[c+1][1])
	b = int((1.-f) * col[c][2] + f * col[c+1][2])
	return r,g,b

for j in range(row_length):
	for i in range(row_length):
		c, f = divmod(h[j,i] / hmax * (len(col)-1), 1)
		if 0 < h[j,i] < hmax:
			o.putpixel((j,i), interp(int(c), f))
		elif h[i,j] == hmax:
			o.putpixel((j,i), col[-1])
		else: o.putpixel((j,i), col_sea)

o.save("map_height.png")	# save height map
o2 = o.crop((0,0,942,603))
o2.save("map_height_cropped.png")

# taken from hillshade.py:
#def illumination(idata,azdeg=315.0,altdeg=45.):
def illumination(idata,azdeg=225.0,altdeg=45.):
    # convert alt, az to radians
    az = azdeg*np.pi/180.0
    alt = altdeg*np.pi/180.0
    # gradient in x and y directions
    dx, dy = np.gradient(idata)
    slope = 0.5*np.pi - np.arctan(np.hypot(dx, dy))
    aspect = np.arctan2(dx, dy)
    odata = np.sin(alt)*np.sin(slope) + np.cos(alt)*np.cos(slope)*np.cos(-az -\
             aspect - 0.5*np.pi)
    # rescale to interval -1,1
    # 1 means maximum sun exposure and 0 means complete shade.
    odata = (odata - odata.min())/(odata.max() - odata.min())
    return odata

il = 255 * illumination(h)

o4 = Image.new('RGBA', il.shape)
for j in range(row_length-1):
	for i in range(row_length-1):
		v = int(il[j,i])
		if 0 <= v < 128:
			alpha = (255 - 2*v)
			o4.putpixel((j,i), (0,0,0,alpha))
		elif v == 128:
			o4.putpixel((j,i), (0,0,0,0))
		elif 128 < v < 256:
			alpha = 2*(v-128)
			o4.putpixel((j,i), (255,255,255,alpha))
		else:
			o4.putpixel((j,i), (255,255,255,0))
o4.save("il_NW_alpha.png")	# NW-illuminated (alpha transparency for use with Inkscape)
Lisanslama
Ben, bu işin telif sahibi, burada işi aşağıdaki lisanslar altında yayımlıyorum:
Bu dosya, Creative Commons Atıf-Benzer Paylaşım 3.0 Taşınmamış lisansı ile lisanslanmıştır
- Şu seçeneklerde özgürsünüz:
- paylaşım – eser paylaşımı, dağıtımı ve iletimi
- içeriği değiştirip uyarlama – eser adaptasyonu
- Aşağıdaki koşullar geçerli olacaktır:
- atıf – Esere yazar veya lisans sahibi tarafından belirtilen (ancak sizi ya da eseri kullanımınızı desteklediklerini ileri sürmeyecek bir) şekilde atıfta bulunmalısınız.
- benzer paylaşım – Maddeyi yeniden karıştırır, dönüştürür veya inşa ederseniz, katkılarınızı orijinal olarak aynı veya uyumlu lisans altında dağıtmanız gerekir.

|
Bu belgenin GNU Özgür Belgeleme Lisansı, Sürüm 1.2 veya Özgür Yazılım Vakfı tarafından yayımlanan sonraki herhangi bir sürüm şartları altında bu belgenin kopyalanması, dağıtılması ve/veya değiştirilmesi için izin verilmiştir;
Değişmeyen Bölümler, Ön Kapak Metinleri ve Arka Kapak Metinleri yoktur. Lisansın bir kopyası GNU Özgür Belgeleme Lisansı sayfasında yer almaktadır. |
İstediğiniz lisansı seçebilirsiniz.
| Annotations | This image is annotated: View the annotations at Commons |
Dosya geçmişi
Dosyanın herhangi bir zamandaki hâli için ilgili tarih/saat kısmına tıklayın.
| Tarih/Saat | Küçük resim | Boyutlar | Kullanıcı | Yorum | |
|---|---|---|---|---|---|
| güncel | 01.01, 5 Nisan 2010 | | 942 × 794 (922 KB) | Morn | corrected color of a lake |
| 00.56, 5 Nisan 2010 |  | 942 × 794 (1,01 MB) | Morn | removed artifacts in shadows | |
| 19.06, 4 Nisan 2010 |  | 942 × 794 (908 KB) | Morn | compass rose | |
| 14.49, 4 Nisan 2010 |  | 942 × 794 (899 KB) | Morn | removed slight banding in the water | |
| 14.41, 4 Nisan 2010 |  | 942 × 794 (904 KB) | Morn | color version | |
| 12.18, 4 Nisan 2010 |  | 942 × 794 (750 KB) | Morn | scale | |
| 20.55, 3 Nisan 2010 |  | 942 × 794 (652 KB) | Morn | {{Information |Description={{en|1=Shaded terrain image of the Naples and Mount Vesuvius region from SRTM3 data. Each pixel corresponds to about 70x70 m.}} |Source={{own}} |Author=Morn the Gorn |Date=2010-03-04 |Permission= |other_ve |
Dosya kullanımı
Bu görüntü dosyasına bağlantısı olan sayfalar:
Küresel dosya kullanımı
Aşağıdaki diğer vikiler bu dosyayı kullanır:
- ast.wikipedia.org üzerinde kullanımı
- as.wikipedia.org üzerinde kullanımı
- cs.wikipedia.org üzerinde kullanımı
- en.wikipedia.org üzerinde kullanımı
- eo.wikivoyage.org üzerinde kullanımı
- es.wikipedia.org üzerinde kullanımı
- et.wikipedia.org üzerinde kullanımı
- fy.wikipedia.org üzerinde kullanımı
- hu.wikipedia.org üzerinde kullanımı
- hyw.wikipedia.org üzerinde kullanımı
- id.wikipedia.org üzerinde kullanımı
- it.wikipedia.org üzerinde kullanımı
- it.wikibooks.org üzerinde kullanımı
- it.wikiversity.org üzerinde kullanımı
- ja.wikipedia.org üzerinde kullanımı
- ka.wikipedia.org üzerinde kullanımı
- ko.wikipedia.org üzerinde kullanımı
- la.wikipedia.org üzerinde kullanımı
- nl.wikipedia.org üzerinde kullanımı
- nn.wikipedia.org üzerinde kullanımı
- oc.wikipedia.org üzerinde kullanımı
- ro.wikipedia.org üzerinde kullanımı
- simple.wikipedia.org üzerinde kullanımı
- sr.wikipedia.org üzerinde kullanımı
- tl.wikipedia.org üzerinde kullanımı
- vi.wikipedia.org üzerinde kullanımı
- zh.wikipedia.org üzerinde kullanımı