
Dosya:AntarcticBedrock.jpg

Bu önizlemenin boyutu: 600 × 600 piksel. Diğer çözünürlükler: 240 × 240 piksel | 480 × 480 piksel | 768 × 768 piksel | 1.024 × 1.024 piksel | 1.400 × 1.400 piksel.
Tam çözünürlük ((1.400 × 1.400 piksel, dosya boyutu: 509 KB, MIME tipi: image/jpeg))
Bu dosya Wikimedia Commons'ta bulunmaktadır. Dosyanın açıklaması aşağıda gösterilmiştir. Commons, serbest/özgür telifli medya dosyalarının bulundurulduğu depodur. Siz de yardım edebilirsiniz. |
Özet
| Açıklama |
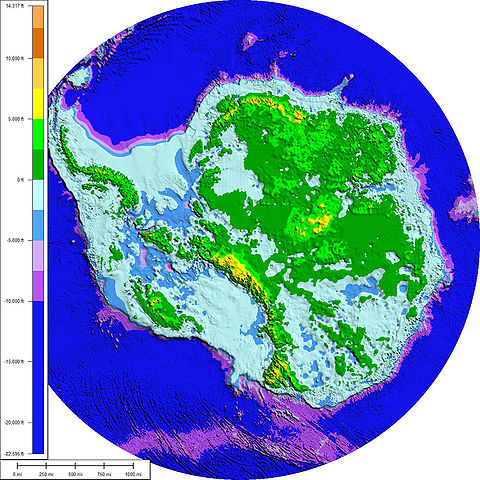
English: The above map shows the subglacial topography and bathymetry of Antarctica. As indicated by the scale on left-hand side, the different shades of blue and purple indicate parts of the ocean floor and sub-ice bedrock, which are below sea level. The other colours indicate Antarctic bedrock lying above sea level. Each colour represents an interval of 2,500 feet in elevation. Map is not corrected for sea level rise or isostatic rebound, which would occur if the Antarctic ice sheet completely melted to expose the bedrock surface. Français : La carte ci-dessus montre la topographie et la bathymétrie sous-glaciaires de l'Antarctique. Comme l'indique l'échelle de gauche, les différentes nuances de bleu et de violet indiquent les parties du fond océanique et du substrat rocheux sous-glaciaire qui sont situées sous le niveau de la mer. Les autres couleurs indiquent les parties du substrat rocheux situées au-dessus du niveau de la mer. Chaque couleur représente un intervalle d'environ 800 mètres (2 500 pieds) d'altitude. La carte n'est pas corrigée de l'élévation du niveau de la mer ou du rebond isostatique qui se produirait si la calotte glaciaire antarctique fondait entièrement, libérant la surface du substrat rocheux. Čeština: Výše uvedená mapa zobrazuje subglaciální topografii a batymetrii Antarktidy. Jak naznačuje měřítko na levé straně, různé odstíny modré a fialové barvy označují části oceánského dna a podledovcového podloží, které se nacházejí pod hladinou moře. Ostatní barvy označují antarktické podloží, které leží nad hladinou moře. Každá barva představuje interval o výšce 2 500 stop (762 m). Mapa není korigována o vzestup mořské hladiny nebo izostatický odraz, ke kterému by došlo, kdyby antarktický ledový příkrov zcela roztál a obnažil povrch skalního podloží. |
| Tarih | |
| Kaynak | This map was prepared from BEDMAP gridded data-set for bed-elevation south of 60 degrees S using Global Mapper 7.0.1. The faint rectilinear pattern seen in the shaded relief is an artifact of the gridding of data from linear seismic surveys. The data used to make this map came from "A new ice thickness and subglacial topographic model of the Antarctic" prepared by the BEDMAP Consortium, which is sponsored by the European Ice Sheet Modelling Initiative, Scientific Committee on Antarctic Research. |
| Yazar | Paul V. heinrich |
Lisanslama
Ben, bu işin telif sahibi, burada işi aşağıdaki lisans altında yayımlıyorum:
Bu dosya, Creative Commons Atıf 3.0 Uluslararası lisansı ile lisanslanmıştır
- Şu seçeneklerde özgürsünüz:
- paylaşım – eser paylaşımı, dağıtımı ve iletimi
- içeriği değiştirip uyarlama – eser adaptasyonu
- Aşağıdaki koşullar geçerli olacaktır:
- atıf – Esere yazar veya lisans sahibi tarafından belirtilen (ancak sizi ya da eseri kullanımınızı desteklediklerini ileri sürmeyecek bir) şekilde atıfta bulunmalısınız.
Dosya geçmişi
Dosyanın herhangi bir zamandaki hâli için ilgili tarih/saat kısmına tıklayın.
| Tarih/Saat | Küçük resim | Boyutlar | Kullanıcı | Yorum | |
|---|---|---|---|---|---|
| güncel | 04.03, 28 Ağustos 2008 | | 1.400 × 1.400 (509 KB) | Cristellaria | == Summary == {{Information |Description=The above map shows the subglacial topography and bathymetry of Antarctica. As indicated by the scale on left-hand side, the different shades of blue and purple indicate parts of the ocean floor and sub-ice bedrock |
| 03.58, 28 Ağustos 2008 |  | 1.400 × 1.400 (509 KB) | Cristellaria | {{Information |Description= |Source= |Date= |Author= |Permission= |other_versions= }} | |
| 20.16, 13 Mart 2008 |  | 1.400 × 1.400 (515 KB) | Cristellaria | {{Information |Description=The above map shows the subglacial topography and bathymetry of Antarctica. As indicated by the scale on left-hand side, the different shades of blue and purple indicate parts of the ocean floor and sub-ice bedrock, which are be |
Dosya kullanımı
Bu görüntü dosyasına bağlantısı olan sayfalar:
Küresel dosya kullanımı
Aşağıdaki diğer vikiler bu dosyayı kullanır:
- ar.wikipedia.org üzerinde kullanımı
- ast.wikipedia.org üzerinde kullanımı
- bn.wikipedia.org üzerinde kullanımı
- bxr.wikipedia.org üzerinde kullanımı
- ca.wikipedia.org üzerinde kullanımı
- cs.wikipedia.org üzerinde kullanımı
- de.wikipedia.org üzerinde kullanımı
- el.wikipedia.org üzerinde kullanımı
- en.wikipedia.org üzerinde kullanımı
- West Antarctic Ice Sheet
- Portal:Maps/Maps/Geographic
- Tipping points in the climate system
- Portal:Maps/Maps/Geographic/11
- Wikipedia:ITN archives/2009/February
- Wikipedia:Graphics Lab/Map workshop/Archive/Apr 2014
- Wikipedia:Reference desk/Archives/Science/2016 July 19
- User:JPxG/Coolpix
- User:JPxG/!
- User:HN016AQ/sandbox
- es.wikipedia.org üzerinde kullanımı
- et.wikipedia.org üzerinde kullanımı
- fr.wikipedia.org üzerinde kullanımı
- fr.wikinews.org üzerinde kullanımı
- gl.wikipedia.org üzerinde kullanımı
- id.wikipedia.org üzerinde kullanımı
- it.wikipedia.org üzerinde kullanımı
- ja.wikipedia.org üzerinde kullanımı
- ka.wikipedia.org üzerinde kullanımı
- kn.wikipedia.org üzerinde kullanımı
- la.wikipedia.org üzerinde kullanımı
- mk.wikipedia.org üzerinde kullanımı
- mn.wikipedia.org üzerinde kullanımı
- nl.wikipedia.org üzerinde kullanımı
- nn.wikipedia.org üzerinde kullanımı
- pl.wikipedia.org üzerinde kullanımı
- pnb.wikipedia.org üzerinde kullanımı
- pt.wikipedia.org üzerinde kullanımı
- sl.wikipedia.org üzerinde kullanımı
Bu dosyanın daha fazla küresel kullanımını görüntüle.