
Dosya:Greenland ice sheet temperatures Vinther et al 2009.png

Tam çözünürlük ((2.006 × 1.129 piksel, dosya boyutu: 472 KB, MIME tipi: image/png))
Bu dosya Wikimedia Commons'ta bulunmaktadır. Dosyanın açıklaması aşağıda gösterilmiştir. Commons, serbest/özgür telifli medya dosyalarının bulundurulduğu depodur. Siz de yardım edebilirsiniz. |

|
Bu galeride bulunan tüm resimler vektörel grafikler kullanılarak SVG dosyası şeklinde oluşturulmalıdır. Bunun çeşitli avantajları vardır; daha fazla bilgi için Commons:Temizleme medyası sayfasına bakın. Eğer bu resmin SVG formatına sahipseniz, lütfen yükleyin. Lütfen SVG dosyanızı yükledikten sonra, bu şablonu bu resimdeki {{vector version available|yeni resim ismi.svg}} şablonu ile değiştirin.
|
Özet
| Açıklama |
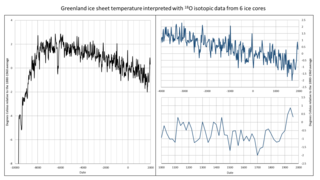
English: The temperature reconstruction produced using data from all six ice cores is shown by the black line in the attached figure, and spans the period from 9690BC to AD1970. The blue lines represent two focus on the dataset, first on the Late Holocene (or Meghalayan) and then on the last millenium. It has a resolution of around 20 years, meaning that each data point represents the average temperature of the surrounding 20 years. So, the end of the record – 1970 – shows the average temperature between 1960 and 1980.
The original data for the creation of these figures have been downloaded from the NOAA website: ftp://ftp.ncdc.noaa.gov/pub/data/paleo/icecore/greenland/vinther2009greenland.txt ORIGINAL REFERENCE: Vinther, B.M., S.L. Buchardt, H.B. Clausen, D. Dahl-Jensen, S.J. Johnsen, D.A. Fisher, R.M. Koerner, D. Raynaud, V. Lipenkov, K.K. Andersen, T. Blunier, S.O. Rasmussen, J.P. Steffensen, and A.M. Svensson. 2009. Holocene thinning of the Greenland ice sheet. Nature, Vol. 461, pp. 385-388, 17 September 2009. doi:10.1038/nature08355 SEE ALSO: Factcheck: What Greenland ice cores say about past and present climate change https://www.carbonbrief.org/factcheck-what-greenland-ice-cores-say-about-past-and-present-climate-change |
| Tarih | |
| Kaynak | Yükleyenin kendi çalışması |
| Yazar | Ambactos55 |
I made these figures to propose a correct version of the previous figure made by Artreve. His version used incorrectly the stated baseline (1880-1960 average) and missed the last centuries from the dataset.
Lisanslama
- Şu seçeneklerde özgürsünüz:
- paylaşım – eser paylaşımı, dağıtımı ve iletimi
- içeriği değiştirip uyarlama – eser adaptasyonu
- Aşağıdaki koşullar geçerli olacaktır:
- atıf – Esere yazar veya lisans sahibi tarafından belirtilen (ancak sizi ya da eseri kullanımınızı desteklediklerini ileri sürmeyecek bir) şekilde atıfta bulunmalısınız.
Dosya geçmişi
Dosyanın herhangi bir zamandaki hâli için ilgili tarih/saat kısmına tıklayın.
| Tarih/Saat | Küçük resim | Boyutlar | Kullanıcı | Yorum | |
|---|---|---|---|---|---|
| güncel | 18.05, 23 Ocak 2020 | | 2.006 × 1.129 (472 KB) | Ambactos55 | Better frame and clipping. |
| 17.45, 23 Ocak 2020 |  | 1.937 × 1.090 (268 KB) | Ambactos55 | {{Information |description ={{en|1=The temperature reconstruction produced using data from all six ice cores is shown by the black line in the attached figure, and spans the period from 9690BC to AD1970. The blue lines represent two focus on the dataset, first on the Late Holocene (or Meghalayan) and then on the last millenium. It has a resolution of around 20 years, meaning that each data point represents the average temperature of the surrounding 20 years. So, the end of the record – 1970... |
Dosya kullanımı
Bu görüntü dosyasına bağlantısı olan sayfalar:
Küresel dosya kullanımı
Aşağıdaki diğer vikiler bu dosyayı kullanır:
- ar.wikipedia.org üzerinde kullanımı
- en.wikipedia.org üzerinde kullanımı
- es.wikipedia.org üzerinde kullanımı
- fr.wikipedia.org üzerinde kullanımı
- ig.wikipedia.org üzerinde kullanımı