
Dosya:Beta distribution pdf.svg

Bu SVG dosyasının PNG önizlemesinin boyutu: 531 × 425 piksel. Diğer çözünürlükler: 300 × 240 piksel | 600 × 480 piksel | 960 × 768 piksel | 1.280 × 1.024 piksel | 2.559 × 2.048 piksel.
Tam çözünürlük (SVG dosyası, sözde 531 × 425 piksel, dosya boyutu: 80 KB)
Bu dosya Wikimedia Commons'ta bulunmaktadır. Dosyanın açıklaması aşağıda gösterilmiştir. Commons, serbest/özgür telifli medya dosyalarının bulundurulduğu depodur. Siz de yardım edebilirsiniz. |
Özet
| Açıklama |
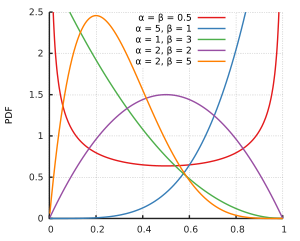
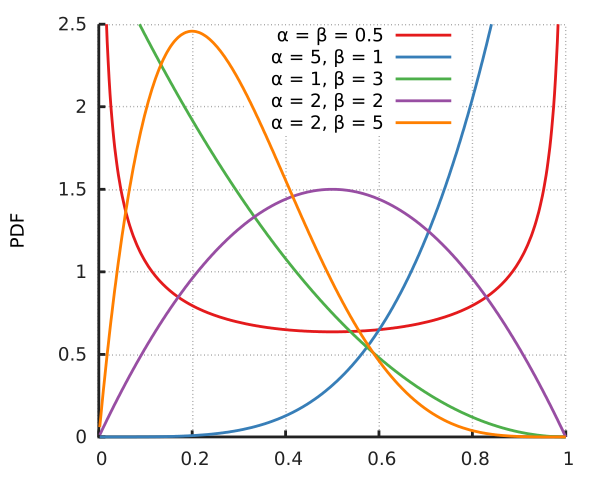
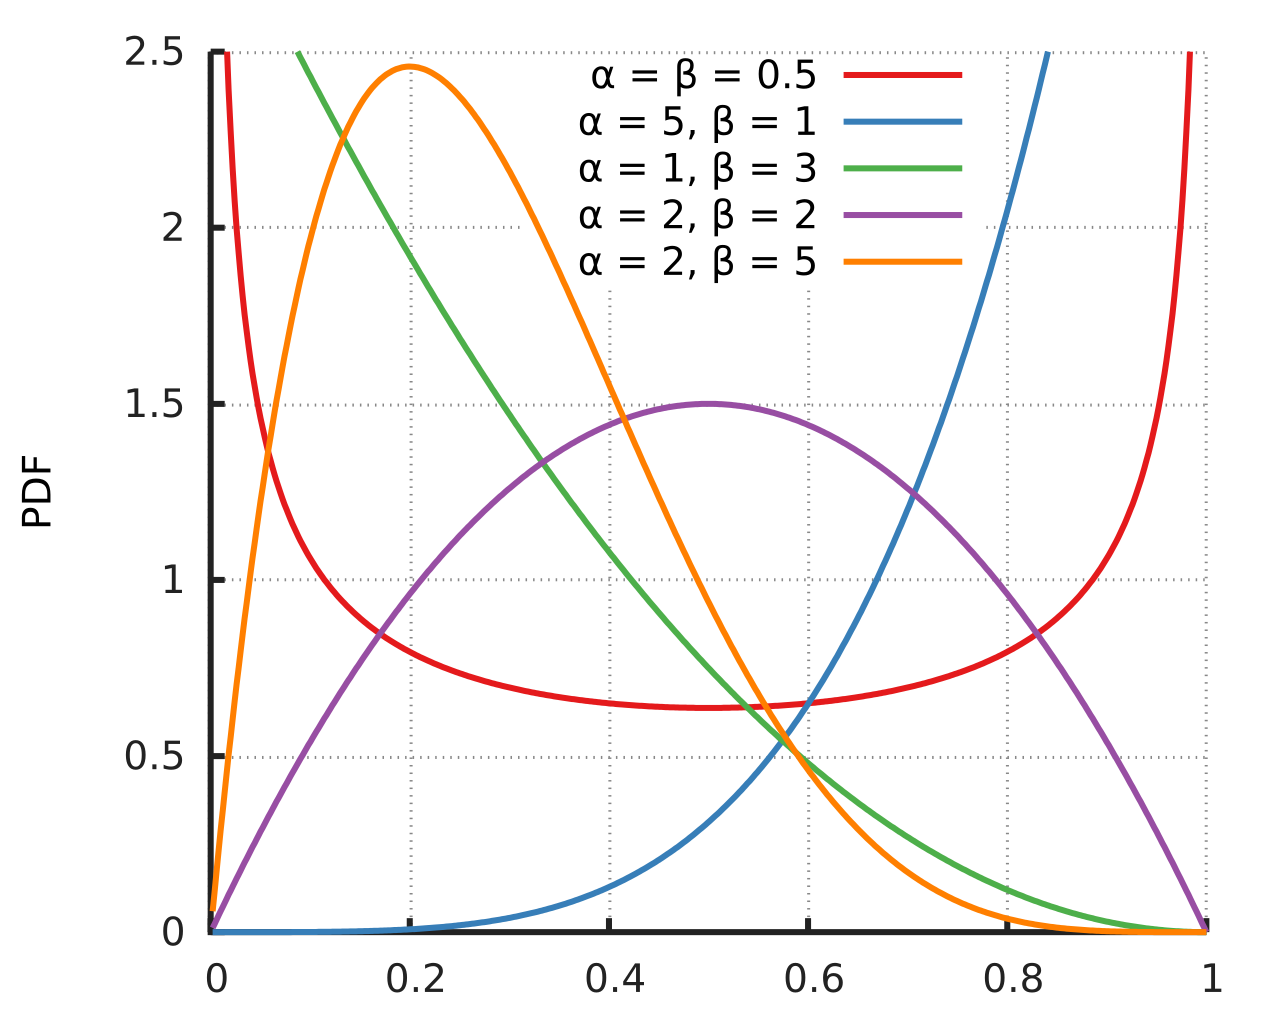
English: Probability density function for the Beta distribution. Created using Gnuplot. |
||||
| Tarih | |||||
| Kaynak | Yükleyenin kendi çalışması | ||||
| Yazar | Horas based on the work of Krishnavedala | ||||
| Diğer sürümler | File:Beta_distribution_pdf.png | ||||
| SVG gelişimi | Bu SVG kaynak kodu geçerlidir. Bu vektörel grafik Gnuplot ile oluşturuldu. | ||||
| Kaynak kodu | Gnuplot code
Data
|
Lisanslama
| Bu çalışma telif hakkı için uygun değildir ve bu nedenle kamu malı kapsamındadır çünkü tamamen ortak mülkiyet ve orijinal yazarlık içermez. |
Dosya geçmişi
Dosyanın herhangi bir zamandaki hâli için ilgili tarih/saat kısmına tıklayın.
| Tarih/Saat | Küçük resim | Boyutlar | Kullanıcı | Yorum | |
|---|---|---|---|---|---|
| güncel | 13.10, 14 Kasım 2014 | | 531 × 425 (80 KB) | Horas | {{Information |Description={{en|1=Probability density function for the Beta distribution. Created using the following code: reset reset session out=2 outputpath= "./" outputfilename="betadistribution" if(out==1) {... |
| 21.45, 4 Haziran 2011 |  | 639 × 489 (68 KB) | Krishnavedala | {{Information |Description ={{en|1=Probability density function for the Beta distribution. Created using python with matplotlib, scipy and numpy toolboxes. <syntaxhighlight lang=" |
Dosya kullanımı
Bu görüntü dosyasına bağlantısı olan sayfalar:
Küresel dosya kullanımı
Aşağıdaki diğer vikiler bu dosyayı kullanır:
- be.wikipedia.org üzerinde kullanımı
- ca.wikipedia.org üzerinde kullanımı
- de.wikipedia.org üzerinde kullanımı
- en.wikipedia.org üzerinde kullanımı
- en.wikibooks.org üzerinde kullanımı
- en.wiktionary.org üzerinde kullanımı
- fi.wikipedia.org üzerinde kullanımı
- he.wikipedia.org üzerinde kullanımı
- it.wikipedia.org üzerinde kullanımı
- ja.wikipedia.org üzerinde kullanımı
- ko.wikipedia.org üzerinde kullanımı
- pt.wikipedia.org üzerinde kullanımı
- tl.wikipedia.org üzerinde kullanımı
- uk.wikipedia.org üzerinde kullanımı
- zh.wikipedia.org üzerinde kullanımı