
Dosya:Piecharts.svg

Bu SVG dosyasının PNG önizlemesinin boyutu: 689 × 494 piksel. Diğer çözünürlükler: 320 × 229 piksel | 640 × 459 piksel | 1.024 × 734 piksel | 1.280 × 918 piksel | 2.560 × 1.835 piksel.
Tam çözünürlük (SVG dosyası, sözde 689 × 494 piksel, dosya boyutu: 39 KB)
Bu dosya Wikimedia Commons'ta bulunmaktadır. Dosyanın açıklaması aşağıda gösterilmiştir. Commons, serbest/özgür telifli medya dosyalarının bulundurulduğu depodur. Siz de yardım edebilirsiniz. |
Özet
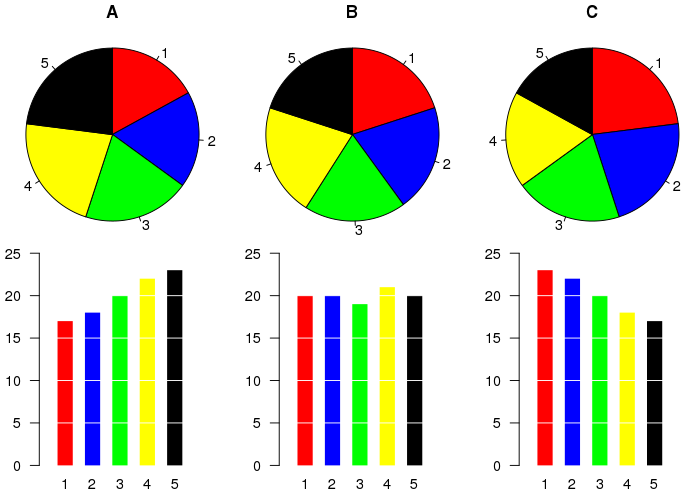
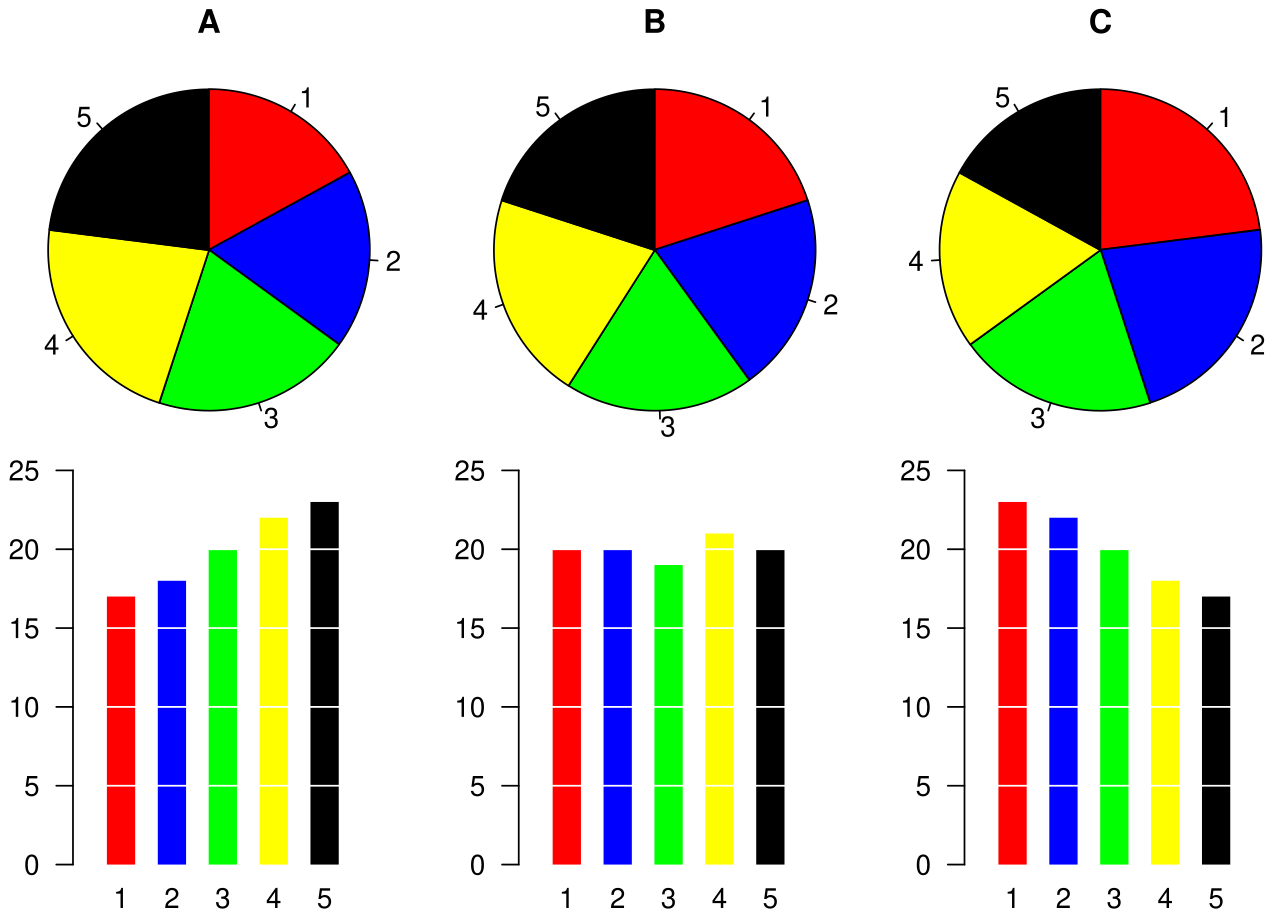
Example of a pie chart, along with a bar plot showing the same data and indicating that the pie chart is not the best possible chart for this particular dataset.
The graphic was created by User:Schutz for Wikipedia on 28 August 2007 using the R statistical project. The program that generated the graphic is given below. The graph was exported in postscript format, converted to SVG using the pstoedit command, and the layout was slightly modified using Inkscape before upload.
Bu SVG kaynak kodu geçerlidir.
Bu vektörel grafik v tarafından R ile oluşturuldu+pstoedit+Inkscape:
Lisanslama
Bu dosya, Creative Commons Atıf 1.0 Genel lisansı ile lisanslanmıştır
- Şu seçeneklerde özgürsünüz:
- paylaşım – eser paylaşımı, dağıtımı ve iletimi
- içeriği değiştirip uyarlama – eser adaptasyonu
- Aşağıdaki koşullar geçerli olacaktır:
- atıf – Esere yazar veya lisans sahibi tarafından belirtilen (ancak sizi ya da eseri kullanımınızı desteklediklerini ileri sürmeyecek bir) şekilde atıfta bulunmalısınız.
Dosya geçmişi
Dosyanın herhangi bir zamandaki hâli için ilgili tarih/saat kısmına tıklayın.
| Tarih/Saat | Küçük resim | Boyutlar | Kullanıcı | Yorum | |
|---|---|---|---|---|---|
| güncel | 08.33, 28 Ağustos 2007 | | 689 × 494 (39 KB) | Schutz | == Summary == Example of a pie chart, along with a bar plot showing the same data and indicating that the pie chart is not the best possible chart for this particular dataset. The graphic was created by User:Schutz for Wikipedia on 28 August 2007 usi |
Dosya kullanımı
Bu görüntü dosyasına bağlantısı olan sayfalar:
Küresel dosya kullanımı
Aşağıdaki diğer vikiler bu dosyayı kullanır:
- cy.wikipedia.org üzerinde kullanımı
- el.wikipedia.org üzerinde kullanımı
- en.wikipedia.org üzerinde kullanımı
- eu.wikipedia.org üzerinde kullanımı
- fi.wikipedia.org üzerinde kullanımı
- he.wikipedia.org üzerinde kullanımı
- he.wikibooks.org üzerinde kullanımı
- ja.wikipedia.org üzerinde kullanımı
- pl.wikipedia.org üzerinde kullanımı
- pt.wikipedia.org üzerinde kullanımı
- ta.wikipedia.org üzerinde kullanımı
- uk.wikipedia.org üzerinde kullanımı
- zh.wikipedia.org üzerinde kullanımı